🔗 https://jnhssg.de/playground/runcard
After a race, two things are left: sore legs and a GPX file. The legs recover on their own. The GPX file usually ends up as a screenshot of a map with a few numbers below it, and that never felt like something I would hang on a wall. So I built runcard, a small tool that turns the track of one run into a card: the finish time set large, the event and the date above it, and in between a picture of how the race actually went.
Disclaimer after my last two posts: this one contains no agents, no prompts and no fancy AI feature. The only model in here is a colour scale. Not every post has to be about AI, some are just about running in circles. 🌀
What is on a card
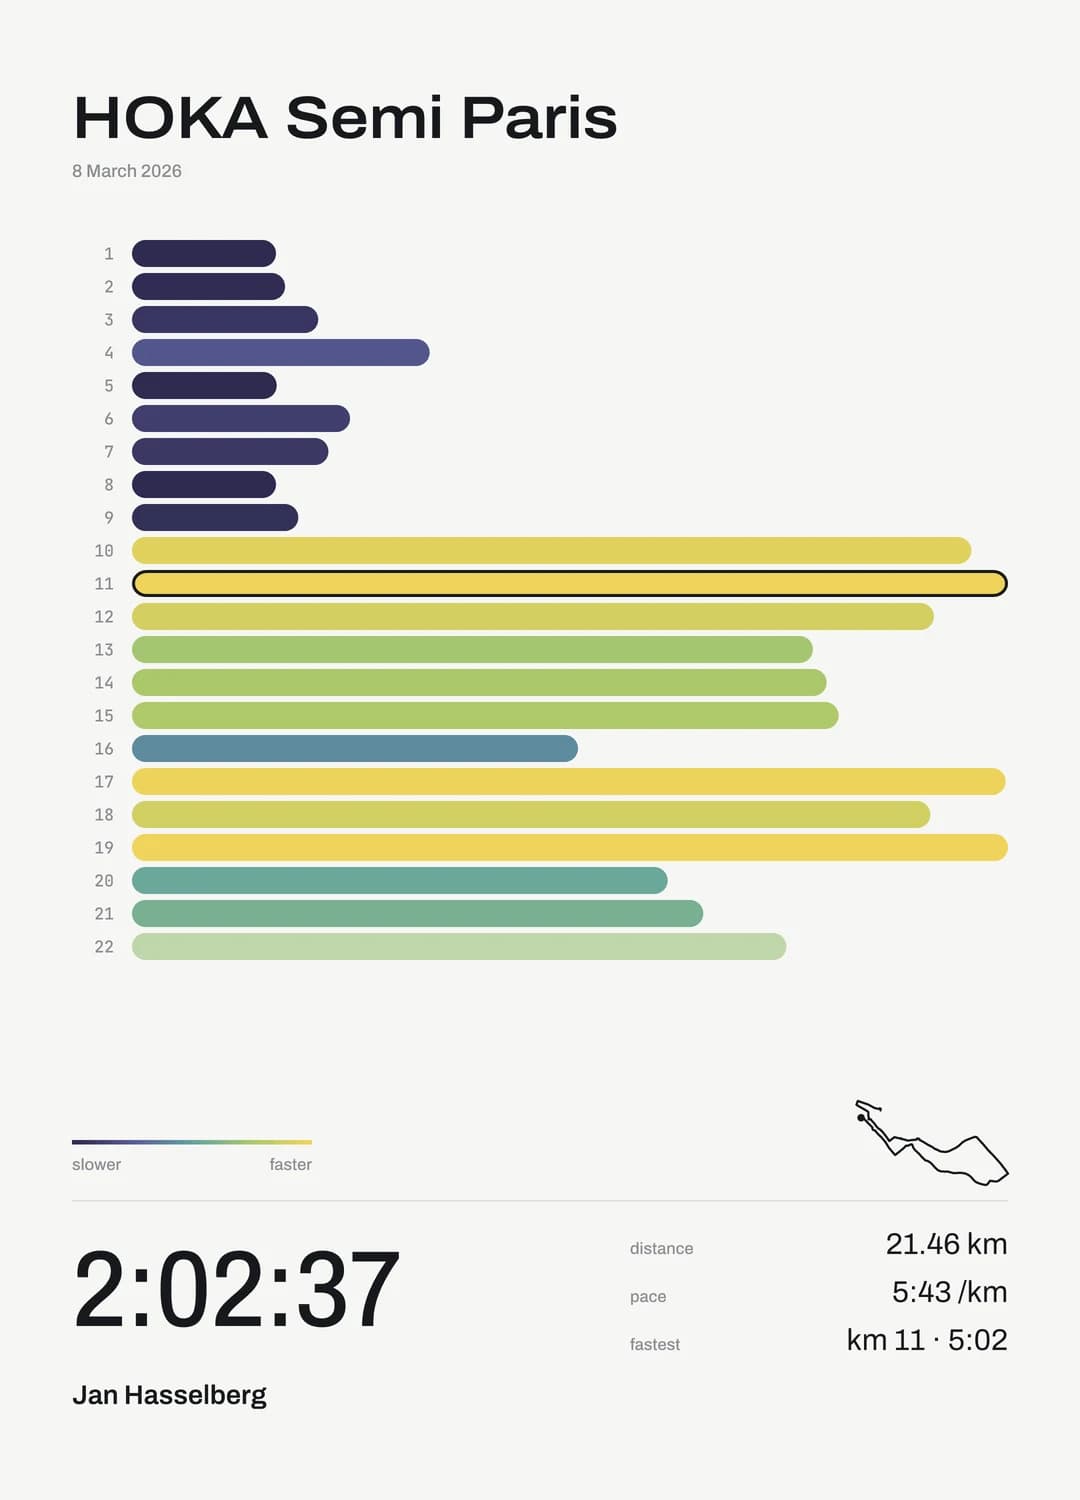
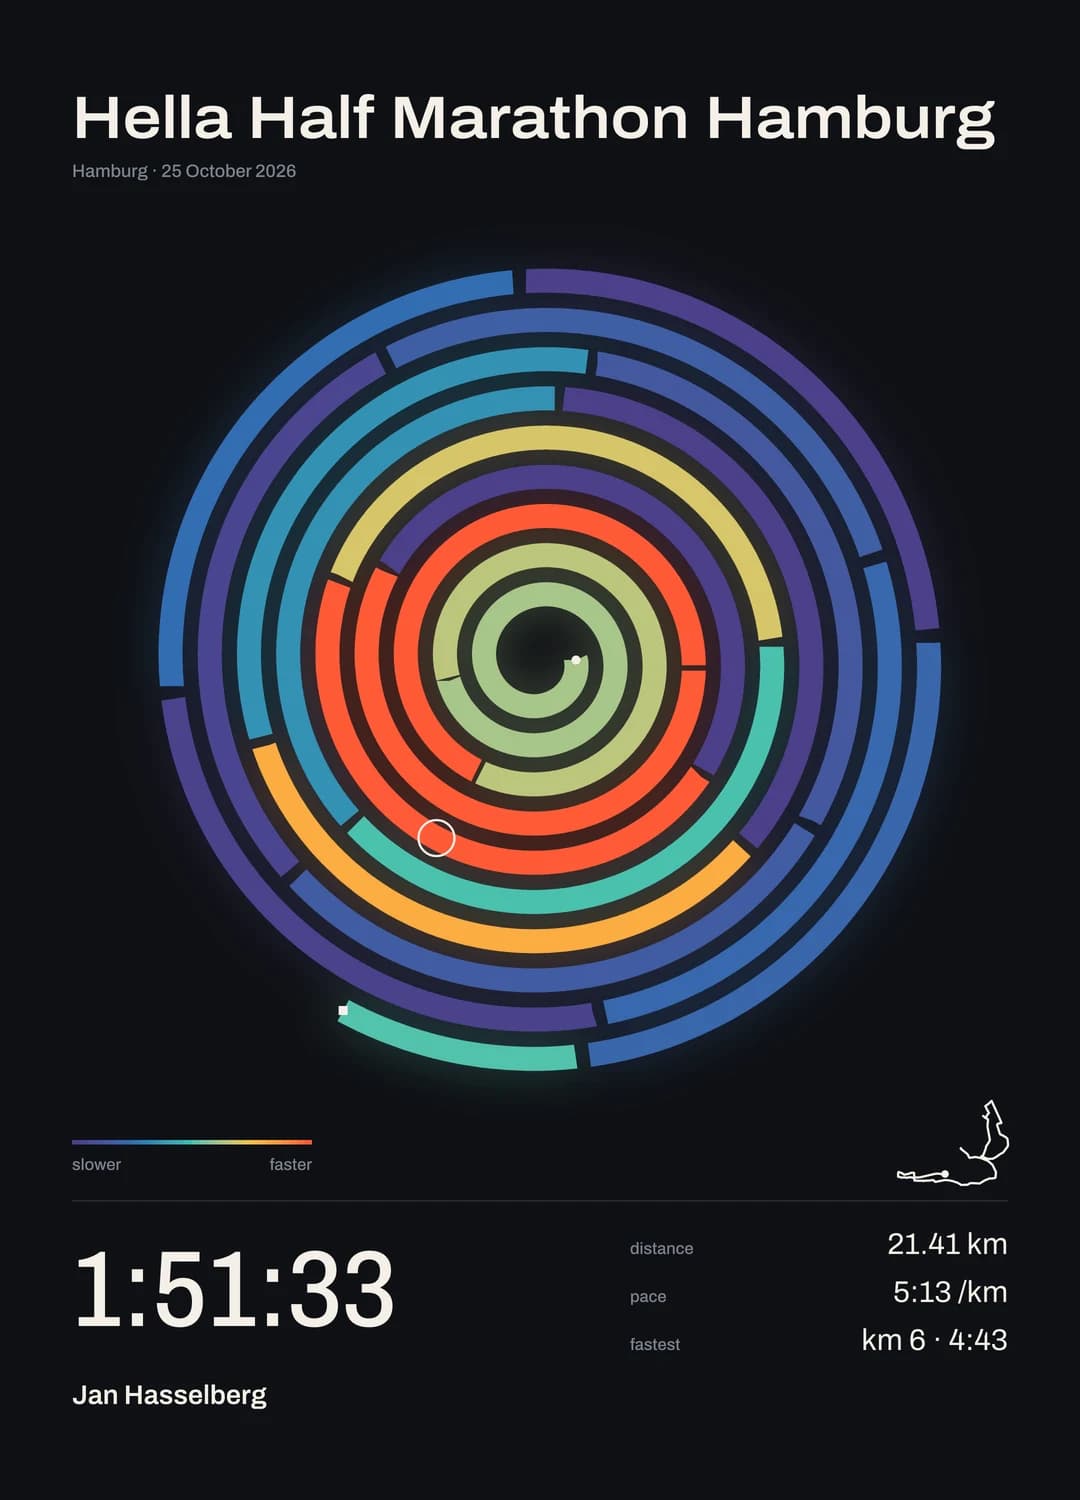
The idea is simple: every kilometre gets a colour by its pace, from deep violet for the slowest to a warm yellow for the fastest. The two cards above tell their stories at a glance. In Paris the first nine kilometres were a slow shuffle through the crowd before the pace finally opened up. In Hamburg the fast part sits in the middle of the spiral, and the outer rings show quite honestly what the last third felt like. 😅
The same splits can be drawn as six different pictures:
- 🌀 spiral: the kilometres wound outward from the centre
- 📊 ribbon: one bar per kilometre, longer the faster it was run
- 🗺️ trail: the route itself, each kilometre in its pace colour
- ⚪ dots: a grid of dots, larger for the faster kilometres
- 🌊 wave: the pace as one smooth curve over the distance
- 📒 ledger: the splits as a table of figures
Every look comes on light or dark paper, and the course is drawn in miniature in the corner, so each run stays recognisable even when the picture is a spiral.
How it works
Runcard is written in Rust and is a plain pipeline with five stages:
- 📍 Parse: read the GPX track with its timestamps
- ⏱️ Analyze: cut the track into kilometres and work out the pace of each one
- 📐 Layout: measure the texts against the bundled fonts, so a long event title is set smaller instead of running off the card
- 🖼️ SVG: fill a MiniJinja template with the result
- 🎨 PNG: rasterise the SVG with resvg and tiny-skia
There is no headless browser and no canvas involved. The card is an SVG the whole way and only becomes pixels in the last step. The fonts and the templates are compiled into the binary, so it runs without any other files. A half marathon renders in about 10 ms on my laptop, and nearly all of that is the PNG encoding.
The same pipeline ships as two binaries. runcard is the CLI:
runcard semi-paris.gpx --runner "Jan Hasselberg" --variant ribbon
runcard-server puts it behind an Axum API that takes the GPX file as a multipart form and answers with the card as PNG or SVG. The editor in the playground of this site talks to that server: drop a GPX file, pick a look and a theme, and the card re-renders as you type. The file is only used to render the card and is not stored.
Infrastructure
The server runs on my K3s cluster at Hetzner and is deployed from the main pipeline on GitHub Actions. The image is a distroless container of about 12 MB with a single binary in it. Every request gets a request id and one structured log line, and every rendered card logs its variant, its size and its render time, so I can see which look is the popular one.
What I learned
🦀 After URL Unicorn this is another Rust project of mine, and the first one where the hard part was not the language but typography. Measuring text before it is drawn, variable font axes, and the question of what happens to a marathon with a very long name took more time than the whole HTTP server. Rust was the right tool for it: one small binary, no runtime, and a compiler that complains long before a runner does.
Try it with your own run, the GPX export of your watch or of Strava is all you need. I still have to earn a card with a time I really like, so the next half marathon is already in the calendar. 🏅
Rust, Axum, Tokio, resvg, tiny-skia, MiniJinja, Clap, Tracing
Next.js, TypeScript, Tailwind CSS
K3s, Docker, GitHub Actions, Hetzner